Springboot and Springcloud has made it easier to develop Microservices in the past couple of years and its usage has increased tremendously. Springboot without Micrometer is like riding a Tesla X without the instrument cluster. Alternatively there are plenty of other tools available to instrument your code to collect metrics and some of them supplied by the metrics aggregators, some are provided by APM vendors and then there is a big gamut of open source projects. When we think about it at the enterprise scale questions like below may arise before choosing the right tool.
Where should I place my instrumentation code?
How to instrument uniformly across systems with the least possible overhead?
What is the impact if we need to change the metrics aggregator?
How to collect multi-dimensional metrics?
Micrometer is one such amazing library which provides out of the box instrumentation for JVM applications and it addresses some of the common problems that we face while instrumenting and collecting metrics. It has first-class support for most of the metrics collectors and new ones getting added at a rapid pace.
Let's see how it works with an example. We will be using spring-boot in our example application and use the micrometer to instrument it. We will be using Prometheus to collect the metrics and visualize the metrics using Grafana. We will re-use some of the code from my previous blog post about Reactive Springboot and but instead of SpringMVC will use WebFlux this time and continue the Kotlin love.
If you're using Spring-boot 2, micrometer is included by default if you include the actuator the dependencies. Actuator endpoints have been changed recently in Springboot 2 and please refer the documentation for the complete list of changes. After adding the actuator, we have to select the registry what we want to use to collect and store the metrics.
compile('io.micrometer:micrometer-registry-prometheus:latest.release')
compile('org.springframework.boot:spring-boot-starter-actuator')
Once the dependencies are included, we need to configure the endpoints and enable Prometheus to let Micrometer to expose the metrics in Prometheus compatible format.
management:
  security:
    enabled: false
  endpoints:
    web:
      exposure:
        include: '*'
Now run the application and visit http://localhost:8080/actuator/prometheus to see the metrics exposed by your service. For most of the applications, the default metrics provided is sufficient enough. However, Micrometer has provided ways to add other binders in your project. By default, micrometer will include the JvmMemoryMetrics, UptimeMetrics, LogbackMetrics (if used), TomcatMetrics (If used). But you can implement the below binders to your application by adding it as a bean and custom binders can be implemented as well.
io.micrometer.core.instrument.binder.cache
io.micrometer.core.instrument.binder.db
io.micrometer.core.instrument.binder.hystrix
io.micrometer.core.instrument.binder.jetty
io.micrometer.core.instrument.binder.jpa
io.micrometer.core.instrument.binder.jvm
io.micrometer.core.instrument.binder.logging
io.micrometer.core.instrument.binder.okhttp3
io.micrometer.core.instrument.binder.system
io.micrometer.core.instrument.binder.tomcat
If you want to include any of the binders, create a bean like below and supply necessary information as required.
@Configuration
class MetricsConfiguration {
@Bean fun cvmMemoryMetrics() = ClassLoaderMetrics()
}
If you want implement your own measurements, I would recommend to go over the concepts of Micrometer. I will demonstrate how you can time a function using the Timer alone. By default in Springboot MeterRegistry is autowired. We have to create a timer object using the Timer interface and then register with the Registry and using the record method we can calculate the time taken by that function.
@Component
class CustomMeters(private val registry: MeterRegistry) {

  val log: Logger = LoggerFactory.getLogger(CustomMeters::class.java)

  val timer = Timer.builder("my")
      .description("custom function timer")
      .tags("custom", "timer")
      .register(registry)

  val temp = timer.record(
      {
        log.info("Time to do some costly operation and sleep")
        TimeUnit.MILLISECONDS.sleep(1500)
      }
  )
}
We can also create cumulative histograms for SLAs and distribution percentiles by simply providing the below configurations. The underlying Histograms collects the number of observations that fall in to each of the predefined buckets(bins) and expose it under the meter name http_server_requests_seconds_bucket.
  metrics:
    distribution:
      percentiles-histogram:
        http.server.requests: true
      sla:
        http.server.requests: 50ms
There bunch of metrics exposed by the Micrometer now and we need to tell the Prometheus where to look for and how often it should pull the data from our service. We will be provide the scrape information in prometheus.yml file.
global:
  scrape_interval:     5s
  evaluation_interval: 5s

scrape_configs:
  - job_name: 'bookstore'
    metrics_path: '/actuator/prometheus'
    static_configs:
    - targets: ['localhost:9080'] #Provide your ip and Do not give localhost as we are running the prometheus in docker
      labels:
        application: bookstore-service
Next we have to create the Prometheus and Grafana scripts. I will be using the below docker-compose file but you can alternatively use the binaries directly downloaded.
Using the command docker-compose up -d will pull the latest images of Prometheus and Grafana. Alternative you can run them individually using the docker command or download and run the libraries yourself.
version: '3'

services:
  prometheus:
    image: prom/prometheus
    volumes:
      - ./prometheus.yml:/etc/prometheus/prometheus.yml
    ports:
      - 9090:9090
  grafana:
    image: grafana/grafana
    ports:
      - 3000:3000
    depends_on:
      - prometheus
Once the instances are ready, you can visit them at their respective consoles on port 9090 and 3000. Check whether Prometheus is able to connect to your service by looking at the targets (http://localhost:9090/targets) and the bookstore must be shown as 'UP' and then configure the Grafana datasource to point to our Prometheus server. And then import the dashboards https://grafana.com/dashboards/4701 and https://grafana.com/dashboards/5373. One is a JVM metrics dashboard which developed by mweirauch and the other one is a throughput metrics developed by myself. Most of the metrics required to monitor a service has been covered in the dashboards. It is very easy to extend or add additional metrics and visualize it.
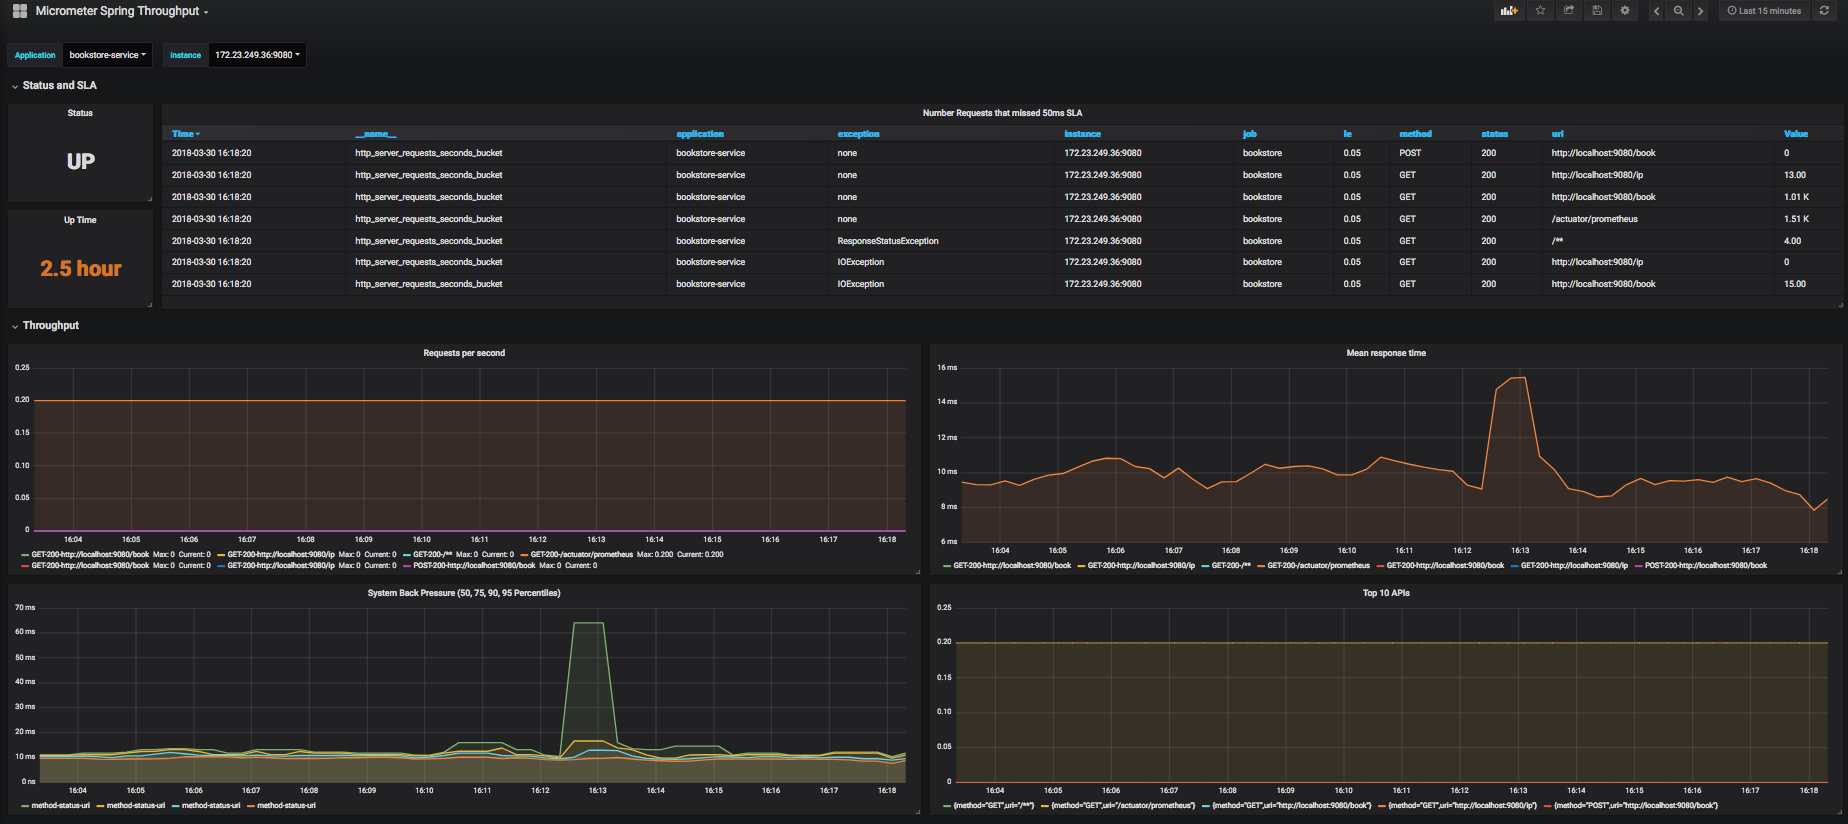
For example if you notice the tab Mean response time which is calculated using the total time taken to serve the requests and the total number of requests.

rate(http_server_requests_seconds_sum{application="$application", instance="$instance"}[1m]) /
rate(http_server_requests_seconds_count{application="$application", instance="$instance"}[1m])
We can calculate to the request duration in which we have served 95% of requests using the histogram_quantile function. As we have see above we are sending the bucketed observations of http_server_requests_seconds to Prometheus using the predefined percentiles (percentiles are a form of quantile where distributions are bucketed in 100 qunatiles).
histogram_quantile(0.95, sum(rate(http_server_requests_seconds_bucket{application="$application", instance="$instance"}[1m])) by (le))

Another example we can calculate the top 10 API endpoints by using the below query. The insights that we can derive from using the predefined functions are amazing and we can mix match them as per our wish.
topk(10, sum by(uri, method) (rate(http_server_requests_seconds_count{application="$application"}[1m])))
It is also important to note that like any instrumentation library, there will always be some overhead but it is negligible. Simply adding every available binder and capture metrics for every function may affect your application performance by a huge factor. It is always wise to decide what you want to capture and ignore before adding any meter. As always the code is available in Github, please feel free to clone and share your dashboards. You can also join Micrometer slack if you want to explore more and the folks there are very nice there and helpful.
References:
https://micrometer.io/docs/concepts
https://prometheus.io/docs/practices/histograms/
https://docs.spring.io/spring-boot/docs/current/reference/htmlsingle/#production-ready-metrics

Some improvements:
[cc]@Bean fun cvmMemoryMetrics(): ClassLoaderMetrics {
return ClassLoaderMetrics()
}
}[/cc]
can be refactored to (thanks to expression body):
[cc]@Bean fun cvmMemoryMetrics() = ClassLoaderMetrics()[/cc]
[cc]@Component
class CustomMeters(private var registry: MeterRegistry) {
fun CustomMeters(registry: MeterRegistry) {
this.registry = registry
}
}[/cc]
can be refactored to (thanks to constructors and immutability):
[cc]@Component
class CustomMeters(private val registry: MeterRegistry)[/cc]
Plus, most of the time, type is infered by the compiler:
[cc]var timer = Timer.builder(“my”)
.description(“custom function timer”)
.tags(“custom”, “timer”)
.register(registry)[/cc]
And also prefer immutability by using val:
[cc]val timer = Timer.builder(“my”)
.description(“custom function timer”)
.tags(“custom”, “timer”)
.register(registry)[/cc]
Thanks Nicolas. I have incorporated it.
Thanks for the article, I’ve found a few glitches:
Spring Boot manages dependency management for Micrometer so that
latest.releaseisn’t necessaryThe enabled flag is not necessary, this is detected based on the presence of the implementation adapter on the classpath
management.security.enableddoesn’t exist anymore in Spring Boot 2There is actually a lot more binders that are auto-configured by Spring Boot. The
ClassLoaderMetricsyou defined in your example is already auto-configured automaticallyThanks Stéphane. I will update the repo and the article accordingly.